PingSLA is the monitoring platform for uptime, synthetic flows, and incident alerts.
22 Probe Nodes, 16 Countries, 30-Second Checks, 15-Day Trial
Monitor websites, APIs, login flows, checkout journeys, SSL, heartbeats, and SLAs from multi-region probes, then push instant incident alerts to the channels your team already uses.
- Monitor uptime, APIs, SSL, domains, and cron heartbeats
- Validate real login, checkout, and payment journeys
- Catch silent JavaScript and third-party integration failures
- Investigate incidents from 22 probe nodes across 16 countries
- Route alerts to WhatsApp, Slack, PagerDuty, and Discord
No credit card required|PayPal&Razorpayaccepted|AWS Activate · NVIDIA Inception member
Real coverage: 22 probe nodes across 16 countries including Bangalore, Mumbai, Singapore, Frankfurt, London, and UAE.
Backed by leading infrastructure programs
Accepted into AWS Activate, DigitalOcean Startups, NVIDIA Inception, and MongoDB for Startups — not every application is approved.
 AWS Activate
 DigitalOcean Startups
 NVIDIA Inception
 MongoDB for Startups
Monitoring for Uptime, Checkout, Login & API Flows
PingSLA detects the failures that cost you money and customer trust, not just the ones that trigger a basic health check.
What is PingSLA?
PingSLA is a monitoring platform for uptime checks, synthetic monitoring, SLA tracking, and incident alerts. It runs real user-path checks every 30 seconds from 22 probe nodes across 16 countries, then alerts teams through WhatsApp, Slack, PagerDuty, and Discord. Unlike uptime-only tools, PingSLA validates whether business-critical actions actually work, including payment iframe rendering, multi-step authentication paths, and API outcomes. It is built for engineering teams that need to detect silent failures before revenue and customer trust are impacted.
How PingSLA works
From URL input to incident alert, PingSLA follows a deterministic flow engineered for fast triage.
Define the flow
Choose checkout, login, or API paths in the no-code builder and set pass/fail assertions for each critical step.
Run global checks
PingSLA executes synthetic checks every 30 seconds from 22 probe nodes across 16 countries.
Validate outcomes
The engine verifies real behavior such as form interaction, payment iframe load, and expected API/login results.
Alert the right channel
On failure, incidents are pushed immediately to WhatsApp, Slack, PagerDuty, and Discord for response.
Who is PingSLA for?
PingSLA is designed for teams that need proof their critical user journeys work continuously.
E-commerce engineering teams
Teams that need to detect checkout and payment breakage before failed orders and support spikes reveal the issue.
SaaS developers
Product and platform engineers who need login, onboarding, and API flow validation beyond endpoint uptime checks.
Solo founders
Operators who need production-grade monitoring without building custom synthetic infrastructure from scratch.
Agencies managing client sites
Service teams responsible for multiple client journeys that need repeatable checks and immediate incident visibility.
Three layers of protection
From infrastructure basics to managed enterprise monitoring - we cover every layer of your stack.
Infrastructure Monitoring
The foundation. Make sure your servers, certificates, and domains are healthy.
Flow Monitoring
The differentiator. Test actual user journeys - not just endpoints.
Managed Monitoring
Full service. We write, maintain, and monitor your flows for you.
Enterprise clients: Dedicated support, custom scripts, quarterly audits
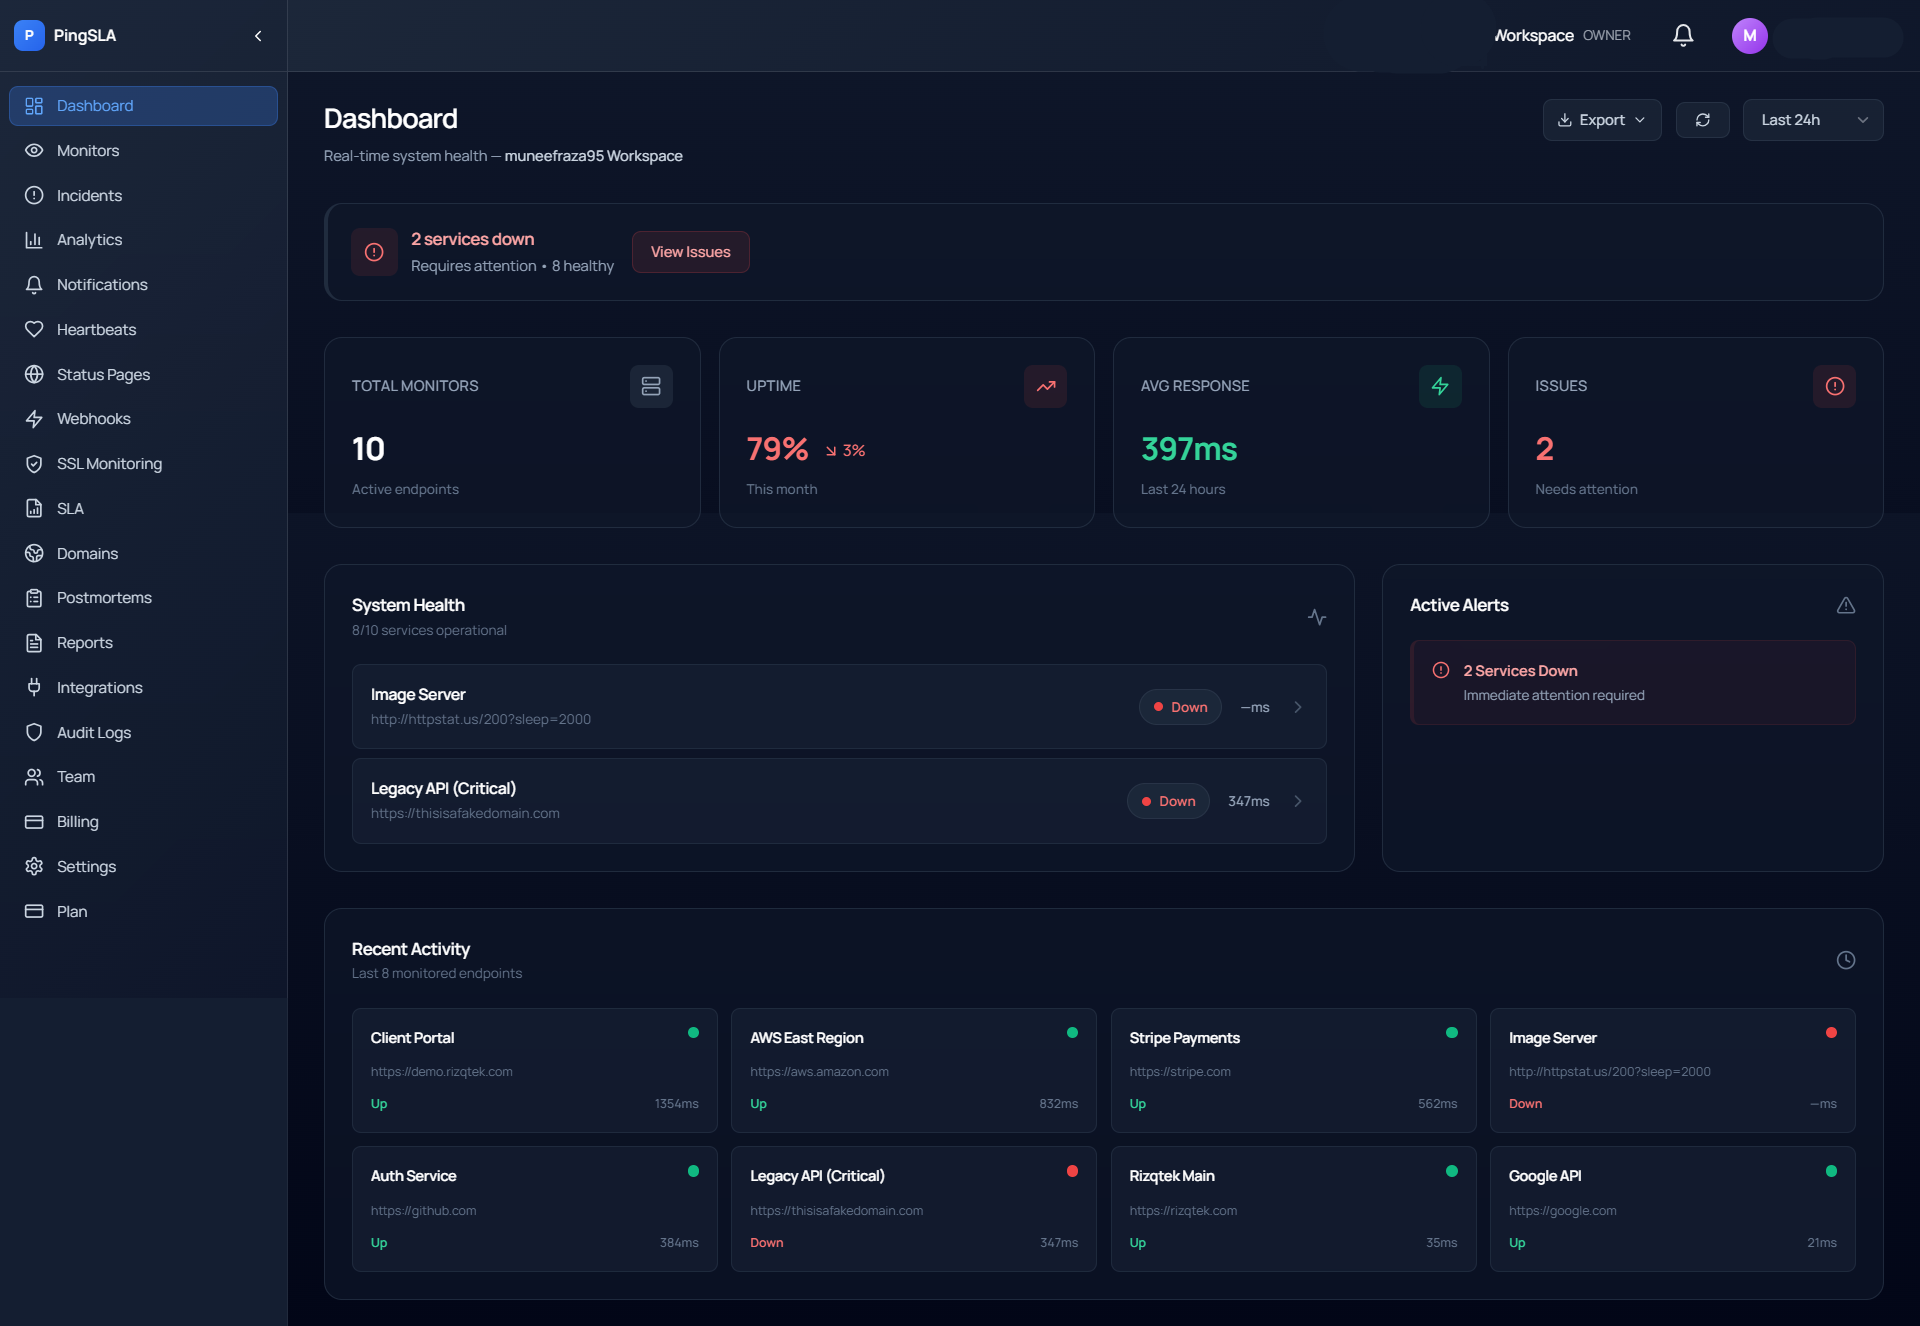
One dashboard. Zero context-switching.
Stop jumping between CloudWatch, Slack, PagerDuty, and spreadsheets. Everything you need to detect, alert, and report — in one interface built for engineering teams.
Real incident from last Tuesday
Our API went down at 2:14 AM. PingSLA detected it in the next 30-second check, sent alerts to our on-call engineer's Slack + WhatsApp, and logged the full timeline. By 2:24 AM, we had scaled our DB connection pool and resolved the incident — before any customer support tickets came in.
API timeout detected
2:14:03 AM
us-east-1 region
Alerts sent
2:14:04 AM
Slack + WhatsApp to 3 on-call
Sarah acknowledged
2:16:22 AM
Incident #1847 opened
Fix deployed
2:23:15 AM
DB connection pool scaled
Service recovered
2:24:01 AM
MTTR: 9m 58s
11 alerts sent in last incident
Detect in 30 seconds
8x faster detectionMulti-region health checks every 30s. Catch failures 8x faster than manual monitoring.
Alert in <1 second
Sub-second deliveryInstant routing to Slack, WhatsApp, Discord, PagerDuty, and webhooks. Your team knows before your customers do.
Export SLA reports
3 hours -> 10 secondsOne-click uptime reports for stakeholders. No more spreadsheet gymnastics.
Public status pages
-40% support loadAuto-updating status.yourcompany.com. Reduce support tickets by 40% during incidents.
SSL expiry warnings
Zero surprise outages30/14/7-day alerts before certs expire. Never wake up to a broken HTTPS site.
Full incident audit
Complete paper trailEvery outage logged with detection time, alert delivery, and resolution. Perfect for post-mortems.
15-day trial on Starter and Growth • 30-second setup • Continuous monitoring when you're ready
Scan thousands of sites in minutes
Bulk scanning capability for agencies, MSPs, and enterprises managing multiple client properties.
PingSLA vs. Traditional Tools
Most uptime tools answer one question: "Is the server up?" PingSLA answers the revenue question: "Can users complete checkout, login, and API-critical flows right now?" That is why PingSLA includes 30-second synthetic checks across 22 probes in 16 countries with direct incident alerts to WhatsApp, Slack, PagerDuty, and Discord.
| Feature | PingSLA | Datadog | UptimeRobot | BetterStack |
|---|---|---|---|---|
| Backed by NVIDIA Inception AI Program | ||||
| Flow Monitoring | ||||
| Checkout Testing | ||||
| Login Validation | ||||
| JS Error Capture | ||||
| Multi-step Flows | ||||
| Basic Uptime | ||||
| SSL Monitoring |
Uptime tools tell you the server is responding. We tell you if your revenue is flowing.
OpsPilot AI is live. Five autonomous agents investigate the moment a monitor fails — alert to full postmortem in under 30 seconds.
See how OpsPilot worksFree Uptime Monitoring Tools — No Signup Required
Run all 10 free tools from one place. Every result comes from live checks against real endpoints and probes.
Infrastructure Audit
apiDeep website audit for SSL, DNS, performance, and security posture.
Login Validator
apiDetect authentication flow and login page issues with real browser checks.
Checkout Defender
apiVerify e-commerce checkout reliability end to end.
API Deep-Scan
apiRun API endpoint health checks and timing validation.
Health Pulse
apiMulti-region health pulse using dedicated free-tools probes.
SSL + DNS Hunter
apiInspect SSL chain and DNS correctness for a domain.
Webhook Checker
apiSend realistic webhook payload tests to validate receivers.
Schema Validator
apiValidate response schema shape from live endpoints.
Retry Tester
apiAnalyze retry behavior, attempt counts, and timing patterns.
Latency Detector
apiRun repeated latency sampling for statistical analysis.
Vajid Ali
Founder, PingSLA · Rizqtek
I'm Vajid Ali, a full-stack developer from India. I built PingSLA after a broken Stripe payment iframe silently failed for 4 hours while our uptime monitor showed 100% green — we lost revenue before a customer told us. PingSLA is accepted into AWS Activate, DigitalOcean Startups, NVIDIA Inception, and MongoDB for Startups. We're early-stage and honest about it — but we run real infrastructure, and we're building in public.
Know when your revenue breaks. Not just your server.
Stop trusting green dashboards. Start monitoring what actually matters - the flows that generate your revenue.
No credit card required|PayPal&Razorpayaccepted|AWS Activate · NVIDIA Inception member